Get Started Debugging Your Project in Rider with Breakpoints
Real quick let's over how to get your Unreal project running in debug mode.
Game Engine
Unreal Engine 5.5.1
IDE
Rider 2024.3.3
In Rider (and most editors) breakpoints don't work by default. To get breakpoints working in your project you'll have to run your project with the debug configuration.
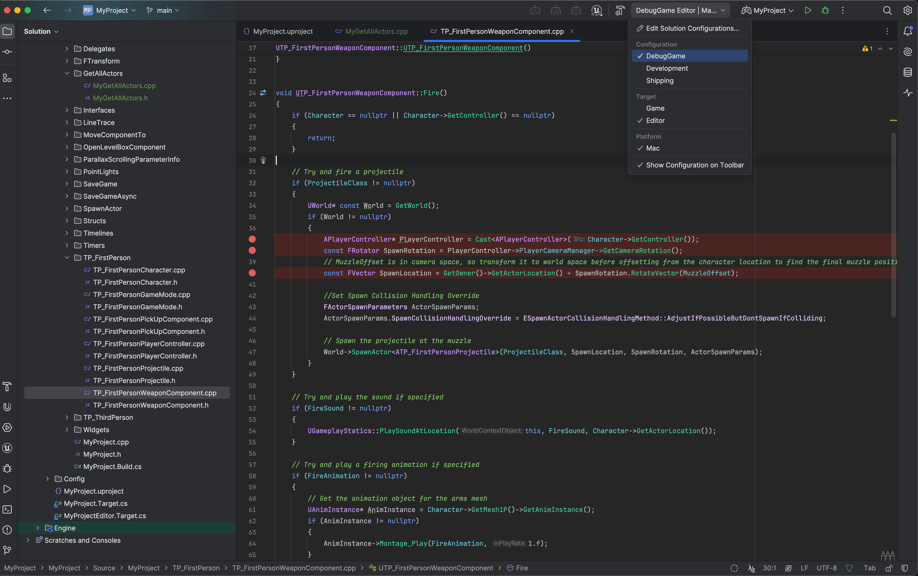
Starting with your project closed, in the top right select the DebugGame configuration from the dropdown and then click the green bug icon to run the project in debug mode.
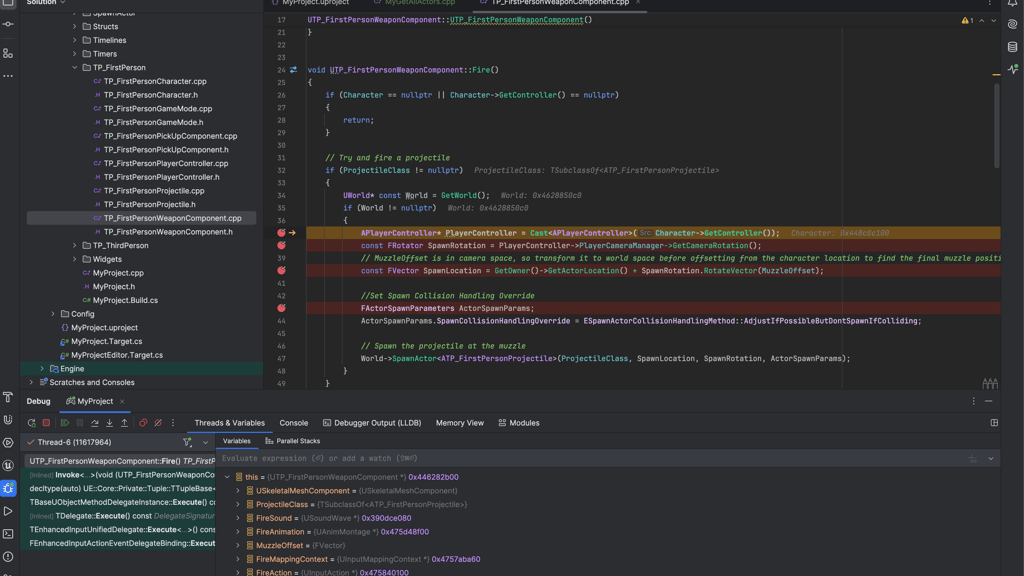
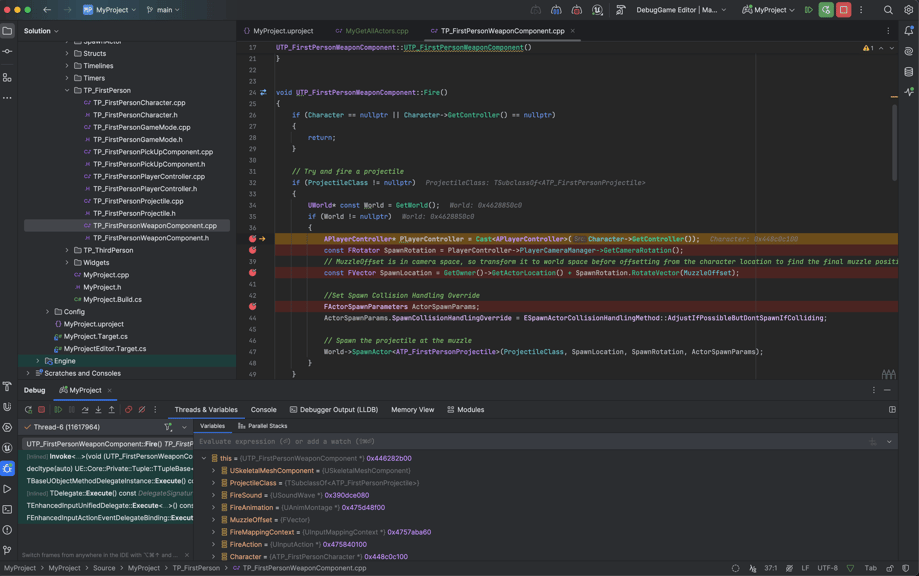
With your project running, breakpoints will now work as expected. In Rider setting a breakpoint is as simple as clicking the line number. When your game hits a breakpoint it'll deliver a lot of usual of information. The debug mode will allow you to view variable values live as they change along with the the debug options allowing you to step to, step through, and step into functions of your code providing some helpful tools for debugging.
Hopefully this helps, I was a little confused why breakpoints weren't working at first.

Harrison McGuire